2) What market do I invest in?

Part 3 of 8 - Where to invest
- Why real estate
- Active vs. passive investing
- What market to invest in
- Classes of properties, locations, tenants
- Building your team
- Section 8
- Landlord friend areas
- Basic order of how to start
- Runtime – 34 minutes
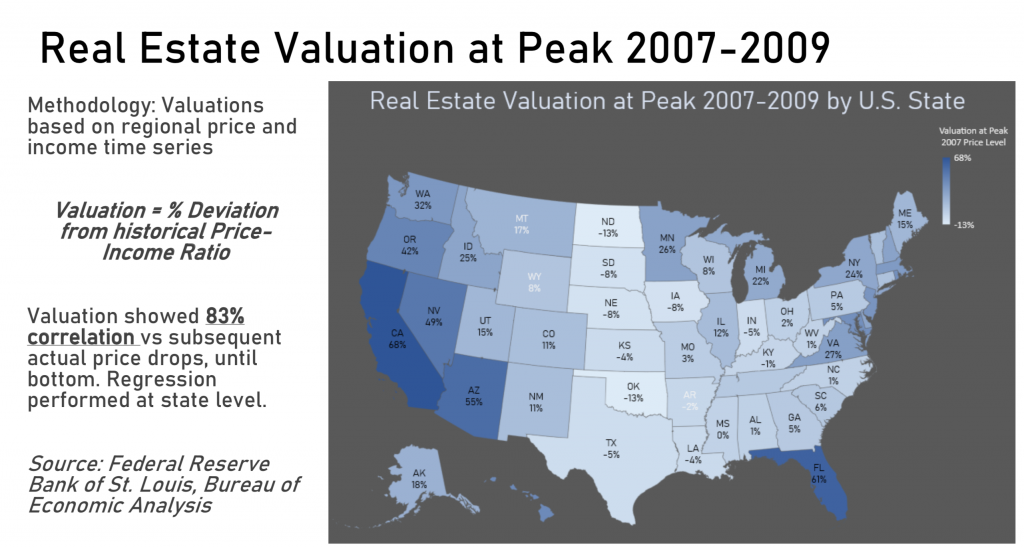
There are 19,354 cities in the United States, which is overwhelming for the new investor. Luckily, this course narrows it down for you!
Here are a few great places to start:
Cash Flow Markets
- St. Louis, MO
- Memphis, TN
- Birmingham, AL
- Indianapolis, IN
- Kansas City, MO
- Atlanta, GA
- Greenville, SC
- Jacksonville, FL
- Tampa, FL
- Houston, TX
- San Antonio, TX
- Little Rock, AR
- Milwaukee, WI
- Charlotte, NC
- Buffalo, NY
- Philadelphia, PA
- Colombus, OH
- Cincinnati, OH
- Dayton, OH
- Cleveland, OH
Appreciation Markets
- Austin, TX
- Portland, OR
- Seattle, WA
- Riverside, CA
- Dallas/Fort Worth, TX
- Denver, CO
- Boston, MA
- Salt Lake City, UT
Just because the cities are great, I encourage you to do your own due diligence as not every house for sale will be a great deal.
Thanks to technology and the internet (and websites like BiggerPockets), you can easily and quickly network with other out-of-state investors. Ask people what markets they are buying in and if they seem friendly and interested in chatting more. Find out WHY they are buying in those markets.
Just find a few people you trust there and start building relationships. I repeat – build relationships!

Incubator students… we like to have you dive through the data but if you get bogged down for more than a couple weeks we can recommend a few markets to help you narrow down your selection and connect you with operators in those areas.
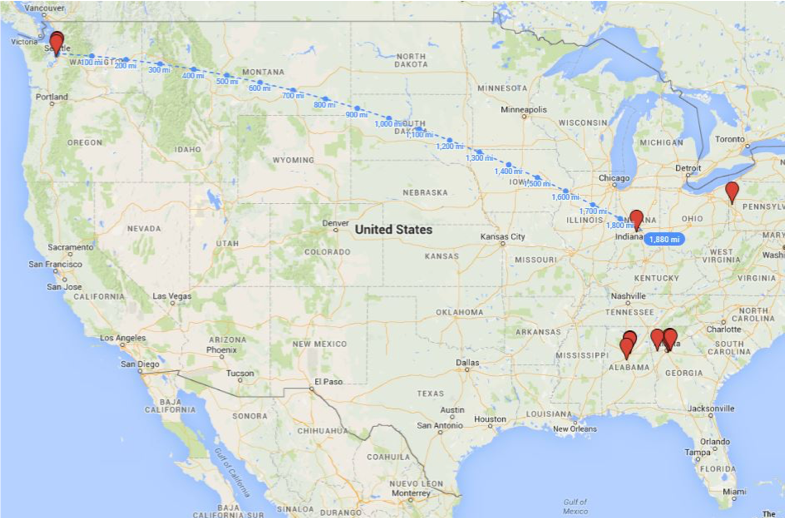
I created relationships first and went into those markets
Understanding Classes
Property Classes
- Class A: new construction, command highest rents in the area, high-end amenities
- Class B: 10 – 15 years old, well maintained, little deferred maintenance
- Class C: built within the last 30 years, shows age, some deferred maintenance
- Class D: over 30 years old, no amenity package, low occupancy, needs work
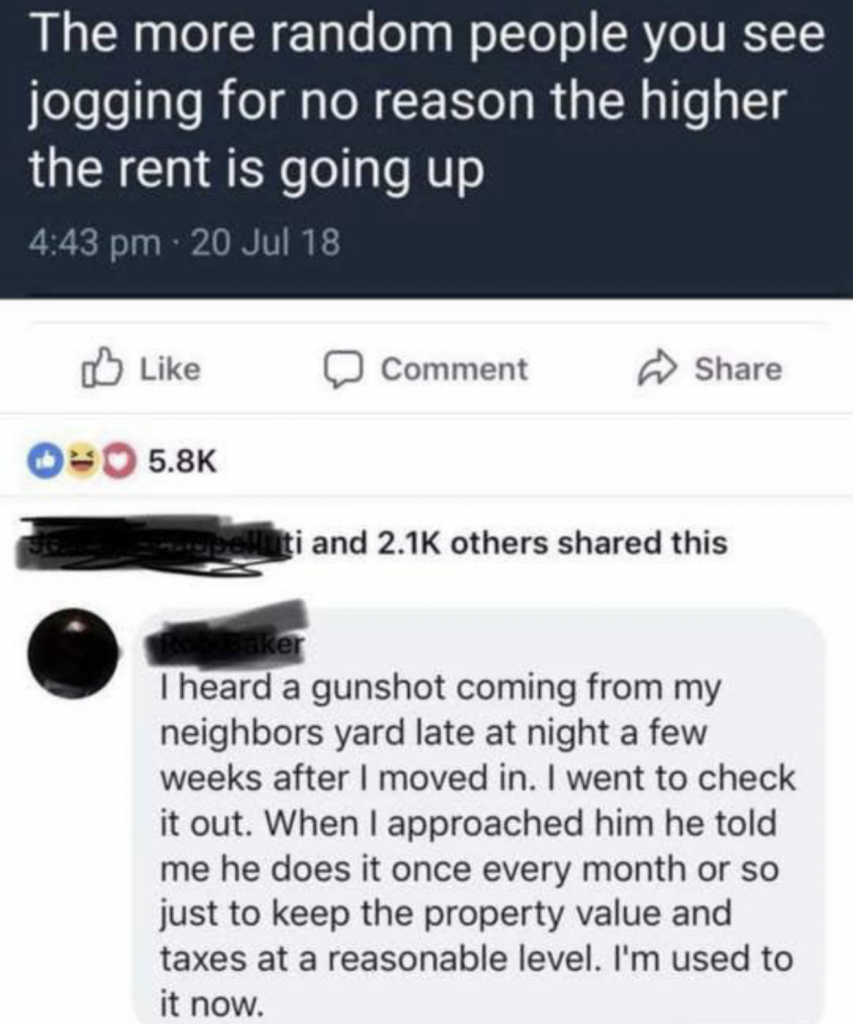
Neighborhood Class
- Class A: most affluent neighborhood, expensive homes nearby, maybe have a golf course
- Class B: middle class part of town, safe neighborhood
- Class C: low-to-moderate income neighborhood
- Class D: high crime, very bad neighborhood
As a real estate investor, it’s often best to buy in “the middle of the market” – not in the high-end areas, but not in the low-end ones either.
The home prices in expensive areas are usually so high, that the rental properties you buy will not produce enough cash flow to cover the higher mortgage payments.
On the other hand, homes in the low-end areas are often cheap and the cash flow looks very attractive on paper. But the low quality tenants these areas attract will create a lot of unforeseen problems, like missed rent payments, higher wear-and-tear on your home, evictions or vandalism. Long-term, these will chip away at your cash flow and significantly reduce your profits.
The sweet spot is often in the middle – in the working-class neighborhoods that attract middle-class families. These areas have a good mix between home prices (not too expensive) and tenant quality (generally good) and attract long-term tenants that are not interested in destroying your home.
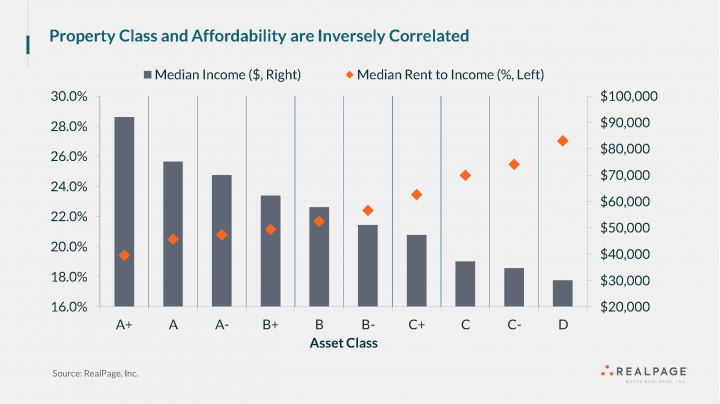
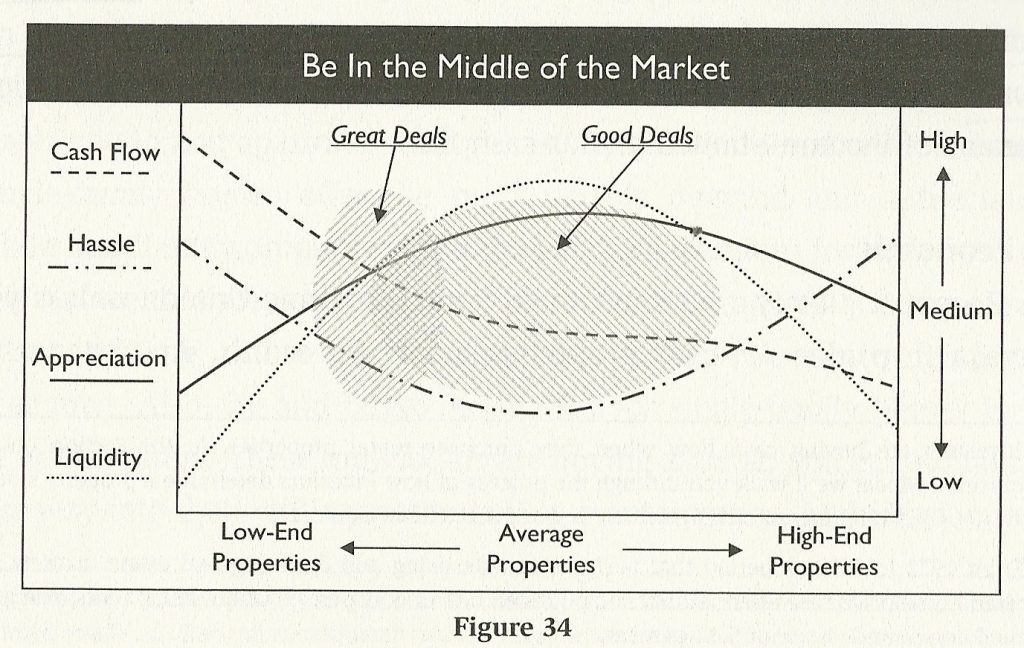
This image is pretty much the most important fundamental that investors need to know. Source – Millionaire Real Estate Investor by Gary Keller
Other considerations when selecting a MSA or City
Population Growth – If the city is between 250,000 and 1,000,000 in population, ideally you want 20% population growth between the year 2000 and the year 2017
- For each year beyond 2017, add 1.25% growth (to the 20% above)
- For cities over a million, add 1%
- For cities under a quarter million, add 2%
Median Household Income – You want around 30% median household income growth between the year 2000 and 2016
- For each year beyond 2016, add 2% growth (to the 30% above)
- Use www.city-data.com for a city (applies to cities of all sizes)
Median House or Condo Value – Look for 40% growth in median house or condo value between the year 2000 and the year 2016
- For each year beyond 2016, add 2.5% (to the 40% above)
- Use www.city-data.com for a city (applies to cities of all sizes)
Change in Crime Levels – Look for crime to go down and for the recent crime number to be below 500
Use the crime table in www.city-data.com
Annual Job Growth – Look for numbers above 2% annualized job growth (1.5% for cities over a million)
How to Evaluate a Neighborhood
To get a sense for a neighborhood, use these quantitative metrics which you can quickly look up online.
The best sources of information are the City-Data and Neighborhood Scout websites which collect dozens of statistics by zip code. You can also search the BiggerPockets forums for discussions about specific areas.
● Crime: Avoid high-crime areas, as they are a direct indicator of the quality of the neighborhood. Owning rentals in “war zones” can lead to vandalism, police activity and frequent evictions. In addition to the resources listed above, Trulia also has some great crime maps. You will not be in the safest areas and there will be theft, vandalism, and other crime however you will want to stay away from homicide incidents or other serious crimes. So differentiate that in the crime incident map that is ofter found on the City’s or Police department’s website.
● Median Household Income: This metric is useful when comparing different areas within a single city. Neighborhoods with lower income tend to attract lower quality tenants, and vice versa. The middle areas you want to focus on will have about average household income for that city. Should be between $40k and $70k for cash flowing rentals (both single family and apartments). Median Contract Rent – Should be between $700 and $1,000
● Schools & Universities: Better schools attract working-class families and students, who usually make up the majority of the renter base. A nearby university or a good public school system can ensure a stable supply of renters in the long-term. If local schools aren’t that great, at least look for areas with a few different options. The GreatSchools website lists school rankings for every US state. Note this is one of the biggest misperceptions of most new investors that have unrealistic expectations.
● Proximity to City Center: Remote areas tend to be less populated and have a smaller tenant base, which in turn can make it more difficult to rent the property. Remote areas will also have less job opportunities. Focus more on urban and suburban areas that are not far from the city center.
● Availability of Shopping and Recreation Activities: Going along with the point above, most people like to live near shops, restaurants, amusement parks, recreational hot-spots and sporting venues. Use Google Maps to see what’s around.
● Flood Zone: Check that elevation is above flood zone if close and show topo map in analysis. Try to stay out of 100 year flood zones.
● Neighborhood Rank: As we covered above, this shouldn’t be your final decision maker, but do take a note of it, as it will have some correlation to the quality of the neighborhood.
● Unemployment Rate – Neighborhood’s unemployment rate should be no more than 2% higher than the city’s unemployment rate
● Poverty Level – Under 20%, but under 15% is strongly preferred if you are risk averse
● Ethnic Mix – Look for multiple slices, with the biggest ethnic mix slice being smaller than 75% of the neighborhood’s residents
Seeing the property in person would be the best way to get a feel for the neighborhood and property type. However, it may not be cost effective for you to visit your purchase. Generally we advocate for you to build relationships with professional and build other non affiliated relationships with other investors to verify what your property manager or broker is telling you.
A “virtual drive-by” of most neighborhoods using Google Maps Street View is a great tool.
Open up Google Maps, zoom in to the property in question and switch to Street View. Then “drive around” the area like you would in a car, covering as much distance as possible. Just keep in mind that the photos may be a few years old. Get a sense of the bad areas with the local crime incident map.


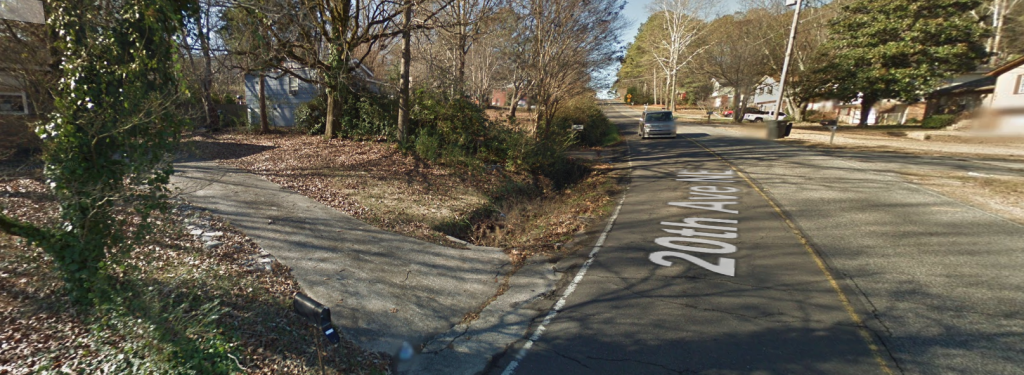
Above: The view that I looked at before I put in an offer on my remote rental
Below: Using the next door properties and indicators of the pride of ownership in the area

Tenant Types – Section 8 vs. Straight Rent
As we mentioned before, in order to meet your Rent-to-Value Ratios needed to cashflow you will likely not be in the best school districts or safest areas. In many Class C areas, we advise on taking a section 8 tenant.
The US Department of Housing and Urban development has a special program that helps low-income families find housing, called the Section 8 voucher program. If a tenant is using it, the government will pay all or a portion of their monthly rent for the duration of their lease. You can read more about it on its official website.
Section 8 tenants are very common in lower-end neighborhoods in many cities. Although you can also find “straight rent” (regular tenants) in the same areas, it is often faster and easier to rent through Section 8. Your turnkey company or property manager will be able to advise you on a particular neighborhood and how likely it is that your property will be rented out through the Section 8 program.
As a landlord, one of the main advantages of having Section 8 tenants is that all or a part of the monthly rent is guaranteed by the government and missed payments are unlikely. Longer lease terms are also more common and you may be able to rent out your property for slightly more.
However, working with the Section 8 program can pose the following challenges:
● It may take longer to rent out a property. The Section 8 approval process typically requires a rent appraisal, walk-through inspection and a final approval by the Section 8 administration. While this usually doesn’t cost you anything, in some cities this process can last 4-6 weeks, which will increase your vacancies.
● Section 8 tenants can cause additional wear and tear. While this is true for any tenants in low-quality neighborhoods, many investors experience additional maintenance and repair expenditures when working with Section 8 tenants.
● Not all of the rent may be guaranteed by the government. The government is not always responsible for paying 100% of the monthly rent. If the Section 8 tenant pays a portion, they can still miss their payments, like any “straight rent” tenant.
Choosing to work with or avoid Section 8 tenants usually comes down to the investor’s preference. If you’re comfortable with purchasing cheaper properties in lower-end neighborhoods to maximize potential cash flow, the Section 8 program may be largely unavoidable, but can provide some rent guarantee.
If you’re buying in middle-class areas and have a choice to rent through Section 8 or not, it’s often best to go with “straight rent” tenants, especially if the potential rents are nearly identical.
Here some specific criteria to look at when buying a house!
Approximate minimums by class of neighborhood. Some markets may be adjusted, but this is a general rule of thumb.
- 4 to 5 star (A Class) = 5-6% cap rates
- 3 to 3.5 star (B Class) = 6-8% cap rates
- 2 to 2.5 star (C Class) = 8-10% cap rates
- 1 to 1.5 star (D Class) = 10%+ cap rates
3+ (2 bed is ok)
1+
800 sq ft+
750+
OK (must be reviewed)
No requirement
Single family 1-4, but no condos
Prefer occupied, will sell vacant
No seasoning of tenants required.
60% of the transactions of Roofstock are buyer financed. Please note, all properties sold with financing will need appraisal based on sales comparables.
Permit Review
You should always check the permit records for any property you buy. If a seller is advertising their property as remodeled or updated, always verify that the proper permits were applied for, issued and finalized. If not, it may go unnoticed or it may be caught years down the road and you could be responsible for remedying the situation.
If you decide to purchase a property in spite of a lack of proper permits, knowing ahead of time is much better than finding out later through code enforcement.
Most municipal websites have a section where you can search for permits. Title companies, lenders and agents do not do this so it’s up to you to do your own research.

Analyzing Crime Rates (Walkthrough)

Within the next two weeks:
Do your due diligence by talking to other investors on BiggerPockets and the internet to find 2-3 markets to invest in.
Incubator students… Come to our next call with a few markets that you like and lets discuss why they are good and why they are bad. We do this because we want you to search a bit in the wide blue ocean of data first but want to calibrate you to what is really happening out there after.
Common pitfall: Students will spend a 1-3 weeks compiling lists like this of various markets. This is good to some extent as it teaches the investor to look at various data sources. However most people spend way too much time doing this as a means of procrastination to avoid getting out of their comfort zone and taking action. In the coming weeks you should be spending your time talking to people and analyzing deals/properties not spinning your wheels with market data. Birmingham, Atlanta, Indianapolis, St Louis, Kansas City, Memphis, Little Rock, Indianapolis, Greenville, Jacksonville, Tampa, Houston, San Antonio, Little Rock, Milwaukee, Cincinnati, Dayton, Cleveland, Ohio, or other secondary or tertiary markets… if does not matter… if you are working with proven people which is why the rolodex access of proven property managers, turnkey providers, and brokers is so important. You network is your net worth.
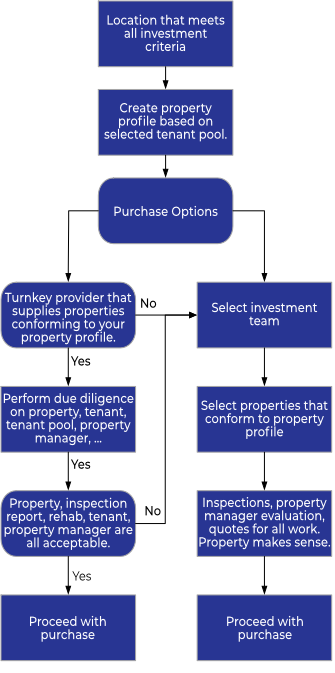
Remote Investor Incubator
Check out the Remote Rental workshop for additional information on “What Market to Invest in”.
